
Money doesn’t give you happiness. Yet, it is much better to be unhappy in your new BMW than on your bicycle 😉
In consulting, you will have to from time to time create or supervise the creation of financial models. They are the bread and butter of every due diligence, restructuring, or even business development project. Sometimes you will have to create a simplified version of a financial model that I call a business model in Excel. Nevertheless, on many occasions, you will have to deliver a full-blow financial model that generates financial statements such as profit and loss, balance sheet, and cash flow. It is not the most thrilling thing to do and you most likely will not have wet dreams about playing with financial models, yet it is a thing that you have to master to be a true badass consultant.
Today, I will show you how to do it fast and efficiently to have more time for procrastination.
As an introduction have a look at the picture below that shows on the left the separate sheets in Excel that you will have to create in order to generate 3 financial statements (profit and loss, balance sheet, and cash flow)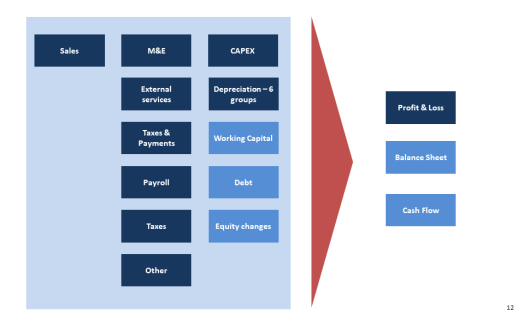
I will explain step by step how you can generate those 3 financial statements. It is always better to work with an example, so I will use the case of a firm that produces hand-made products from clay: ceramic dishes, chimneys, tubes, and pots. On the basis of the data from 2014 and 2015, we want to model their business model till 2022.
Profit and Loss Account.
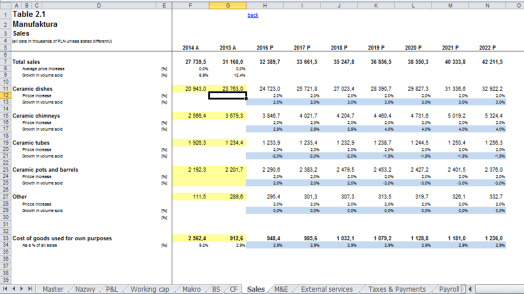
- Sales / Revenues. The first thing you will want to do is to model the profit and loss of the firm. There is no profit without sales, so the first thing to do is to model in a separate sheet the sales/revenues of the firm. Modeling this part is pretty easy. You have to estimate how many products you will sell and at what price. There are plenty of ways in which you can do it. In our example, we will do it on the product group level. We have 4 groups of products: ceramic dishes, chimneys, tubes, and pots. For every group of products, we will define the following drivers of the sales/revenues: # of products sold at the beginning of our analyses, the average price per product at the beginning of our analysis, growth in quantity, and growth in price. Below is the end result:
Let’s look at a few examples of how you can model revenues:
Check also the example of modeling revenues in the case of a producer of consumer goods. - Materials and Energy. Once you are done with the sales you can get down to estimating the costs. For every cost position, we will estimate in a separate sheet. The first thing we will start with is the materials and energy you need to use to produce the products. When it comes to materials and energy we can divide them into fixed and variable. Fixed are set at a certain level and they will not change. Variables will depend on the size of the sales. You can model it by assuming a certain cost per product or you can model it as a set percentage of sales. We will use the latter approach. Below are the end results.

- Payroll and Social Security costs. One of the biggest cost positions is always the salaries and wages. We model it in the sheet Payroll. Again we use a very simple approach. We look at the number of people we have to have and the average costs per employee (including social security, pension plans, etc.). In our example, we model them in 3 separate groups: Head Office (high-paid employees), the Production Plant (lower-paid employees), and the Board of Directors (the overpaid ones). We first model the direct salaries/wages by looking at the number of people, the average salary at the beginning of the analysis, and the assumed per annum growth of salaries. On top of that, we calculate the social security costs as a percentage of the payroll costs. Below are the end results:

- External Services. This cost position we treat in a similar way as materials and energy. We have some fixed part that doesn’t depend on the sales (i.e. rent of the office space) and a variable part that we calculate as a set percentage of the sales. In some cases, you can model it as a set cost per unit of production. Below the end-result

- Depreciation. So far it was a piece of cake. You didn’t have to break a sweat. We were doing simple calculations to model each and every cost position. Depreciation is much more complicated as you have to calculate for every asset 3 things: gross book value (how much I paid for it when it was acquired), depreciation (what part of the gross value I can allocate to costs), net book value (gross value – the sum of all depreciation). On top of that, you have to do it every year separately to track assets. Since a picture is worth a thousand words below is a movie that will explain to you slowly but surely how to do it in practice:
- Taxes and Payments. In cost positions, we have some taxes and payments that we have to pay to the local government. Those taxes don’t depend on profit and are just cost positions. They usually depend on the size of the factory, space, and number of employees. Here we have assumed that those taxes are fixed and only change according to the inflation rate.
- Other costs. As always other costs may appear. Those you can model either as fixed or as a percentage of all costs or sales. I have chosen to model it as a percentage of sales. I applied the same approach also to other operating costs and other operating revenues.
In some cases, you may decide to rather divide the costs into fixed and variable (when it comes to the production costs). Let’s look at such an example for consumer goods:
After we have managed to calculate all cost positions and sales we can combine them into one beautiful sheet Profit & Loss statement. Below is what you will get: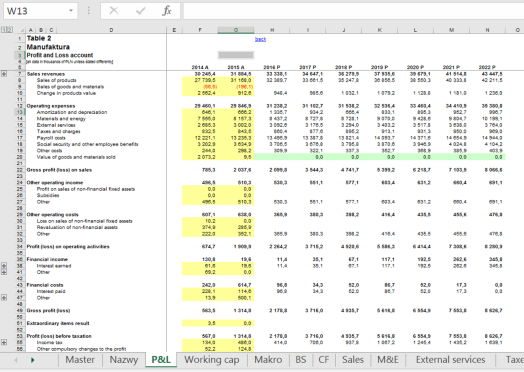
Balance Sheet
Now it’s time to create the balance sheet. So far we have only been able to estimate the net book value of fixed assets that we can use to generate the Fixed Assets part of the Balance Sheet. We still have to estimate the working capital, debt, and equity. This will help us generate the liabilities and current assets. Below is the scheme showing how roughly we will proceed:
Let’s see in detail how we will estimate each and every piece to assemble the balance sheet:
- Working Capital. This part is a little bit more difficult as you have to take into account a lot of components. Below is an overview of all elements that you have to generate to properly estimate the working capital.
 In the Working capital sheet, you will have to estimate how much money will be eaten away by receivables and inventory and to what extent you can rely on financing yourself using liabilities (mainly from suppliers). In most cases, you use as a driver the sales or cost level and specific position in days of sales or days of production. As I said in some cases a movie is the best means of explanation, therefore, below is a movie that will show you how to estimate each and every component of working capital:
 - Debt. Another thing you have to estimate before you start building the balance sheet is the debt, and bank loans that you have taken. In our case, there are 2 loans: an old one and a new one. Since we want to show separately the short-term and long-term debts you have to divide those 2 loans into 2 parts: short-term (what will have to be paid this year) and long-term (what will have to be paid next year). The payment of the loans will depend on the schedule agreed with the banks. We want to pay the old loan now and the new one that we will take this year we want to pay back in 3 years. In this way, in 2022 we will be debt-free 🙂 Below you can see what it will look like in practice in an Excel sheet.

- Equity. The last part that we have to model to assemble the balance sheet is the changes to equity. In our case, we assume that there will be no new paid-in capital from shareholders. We also assume no changes to reserve and revaluation capital. There will be only changes in supplementary capital due to withholding some of the profits. We will pay out 1/3 of profits from the previous year as a dividend in 2017 and after 2017 2/3 of the profits. Below you can see the end results.

- Cash. The only position missing from our calculation is the Cash. This is done on purpose. In the end, we want the Assets to be equal to Liabilities (basic rule of bookkeeping). That’s why in our model the cash will be modeled as a difference between Liabilities and the sum of Assets expected for the Cash. Below is a graph that shows what we want to achieve.
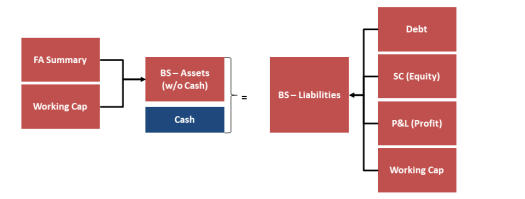 As you can see we get all the necessary data for liabilities from the sheet: Debt, SC (Equity), P&L (profit and loss statement), and Working Cap. Assets are generated mainly using the Working Capital sheet and the Fixed Assets Summary (FA Summary) from which we get the net book value of the assets. The cash is the difference between Liabilities and the sum of assets except for the Cash.
Cash flow.
In the end, you will get a nice-looking balance sheet. The last part of the model is to generate using the balance sheet the cash flow statement. You want the cash flow position we will get from this method to be equal to the cash position generated in the balance sheet. If there is a discrepancy it means that there was some mistake in our model. Below is the general scheme that we will use to generate the cash flow.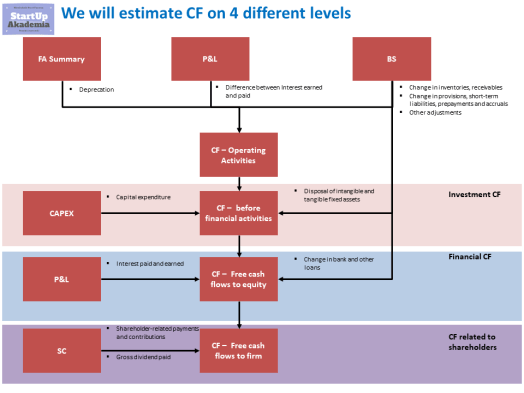 We will start with the net profit and we will use deprecation (from the Fixed Asset Summary sheet), the difference between interest paid and earned (from the Profit and Loss sheet), and changes in inventories, receivables, liabilities, and others (from Balance Sheet) to get to the cash flow from operating activities. This will tell us how much cash was generated from the ongoing business activities. The next stage is to see what will be left after you pay for investments (expansion and maintenance Capex), therefore you deduct from the operational cash flow the cash flow from Investments. Investments made will decrease the cash flow and disinvestment will increase it. Now we have to pay the interest and the loans. That’s why as a next step you deduct the financial cash flow. Taking a new loan or getting interest on your cash will increase the cash flow whereas paying loans and paying interest will decrease it. After this, we finally get to the so-called Free Cash Flow to Equity. We can finally share our profits with shareholders. What is left will increase our cash flow position. Below are the results for our case:
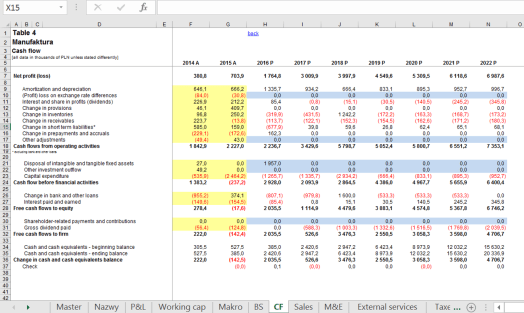
We have finally reached the end of building the financial model. By now you should have plenty of detailed sheets showing in detail the sales generation, cost positions, and their drivers, Capex by groups, debt, equity, and working capital creation along with the underlying assumptions. From this, we got the 3 financial statements: profit and loss, balance sheet, and cash flow. Below is roughly how the data flows between different sheets in Excel.
Next Steps
From here we can go many ways:
- Valuation. We can use the model to estimate the value of the business using DCF or the multiplier method. That’s why during due diligence projects such a model is a must
- Estimation of savings. We can use the model to estimate the impact of potential improvements that we can implement. For example, you can cut down some of its costs, reduce the number of people needed, renegotiate the loans, contract with service providers, etc. The model helps you estimate what could be the impact of your actions both on profit as well as on cash.
- Budgeting and cash flow management. Models like this can be also used to manage the cash flow of the firm or to create the budget for the next year. Such a model also is a must if you do turnaround projects where the cash position and liquidity are even more important than the profitability. In consulting, you may be forced to prepare such a model by the client who wants to re-negotiate with the banks the loans or by banks that want to check whether the business they are asked to finance will not collapse.
Examples of Financial Models.
To show you what the end result can look like let’s look at some examples:
- E-commerce Model. In this model, we concentrated on the profit and loss statement of an e-commerce model. With simple KPIs like the number of visits, conversion, and Average Transaction Value you can create pretty fast a very good model of the whole business.
- Retail Business. In this model, we first create a picture of an average store. Based on that and the assumed number of newly opened stores we forecast the whole business including cash flow
- Consulting Business. It’s interesting to model B2B businesses that deliver professional services. It requires modeling the so-called utilization of the staff, fees, wages, etc. Below you can find a short example
- Short-term rental of real estate. We have also created models of real estate. Below you can see a model of a firm that rents via Airbnb and Booking.com apartments, and rooms.
- Restaurant Business Model. Restaurants are interesting because they are a mix of retail and production businesses. You have to model in a lot of detail the production costs of food and later on the whole chain development (in a similar manner to the retail business).
That’s in short. Below you will find the case we have discussed in the form of a presentation. For more check my online course Financial Modeling for Business Analysts and Management Consultants. As a part of the course, you will get access to all models shown (+30 models) that cover a wide range of industries (e-commerce, marketplaces, SaaaS, Retail, subscription businesses, football clubs, FMCG, SMCG, hotel chains, and many more)
I recommend checking the following courses where you can find all the financial models in Excel and step-by-step guides on how to create them:
- Financial Modeling for Business Analysts and Management Consultants
- Financial Modeling for Startups
- Online Business Models in Excel – Practical Guide
- Offline Business Models in Excel – Practical Guide
Check also the below presentation Essential Finance & Accounting for Management Consultants & Business Analysts:

3 Replies to “How to create a finacial model”